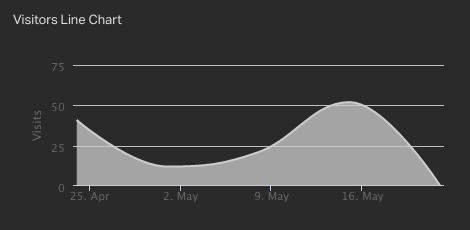
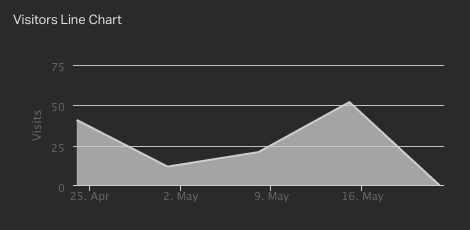
We’ve updated our old style line charts to use straight rather than curved lines. This brings our line charts more in line with data visualisation best practices and matches the style we apply to the line charts found in our most recent integrations (e.g. Spreadsheets and Salesforce).
Today we’ve started rolling out extra controls for displaying your number widgets.
Our new decimal places feature allows you to manually set the precision of numbers in your widgets, so that you can show the level of detail appropriate for your dashboard.
You can also override our automatically-set abbreviations. Numbers can now be shown in their raw state, or as Thousands (K), Millions (M), or Billions (B).
The new Decimal Places and Abbreviation options are currently only available on the Spreadsheets number widget, but we will be rolling the functionality out to other visualisations and integrations in the coming weeks.
This is the first part of a series of improvements we have planned for giving you more control over your visualisations.
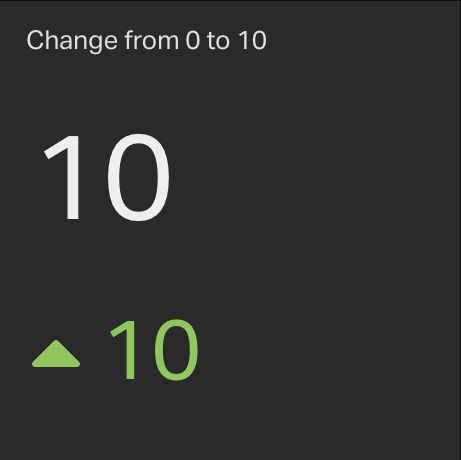
We’ve improved how the number widget’s secondary stat displays a percentage change when the previous value is zero. While what we were doing before was mathematically correct, showing an ‘infinite’ increase or ‘NaN’ isn’t very useful. Now, when your previous value was zero, we always show the absolute rather than relative change. So if your current value is 10 and your previous value was 0 we’ll now show an increase of 10, rather than an infinite percentage increase.
Currently this change just applies to Salesforce, Spreadsheet and Custom number widgets - we’re working on rolling it out across the board.
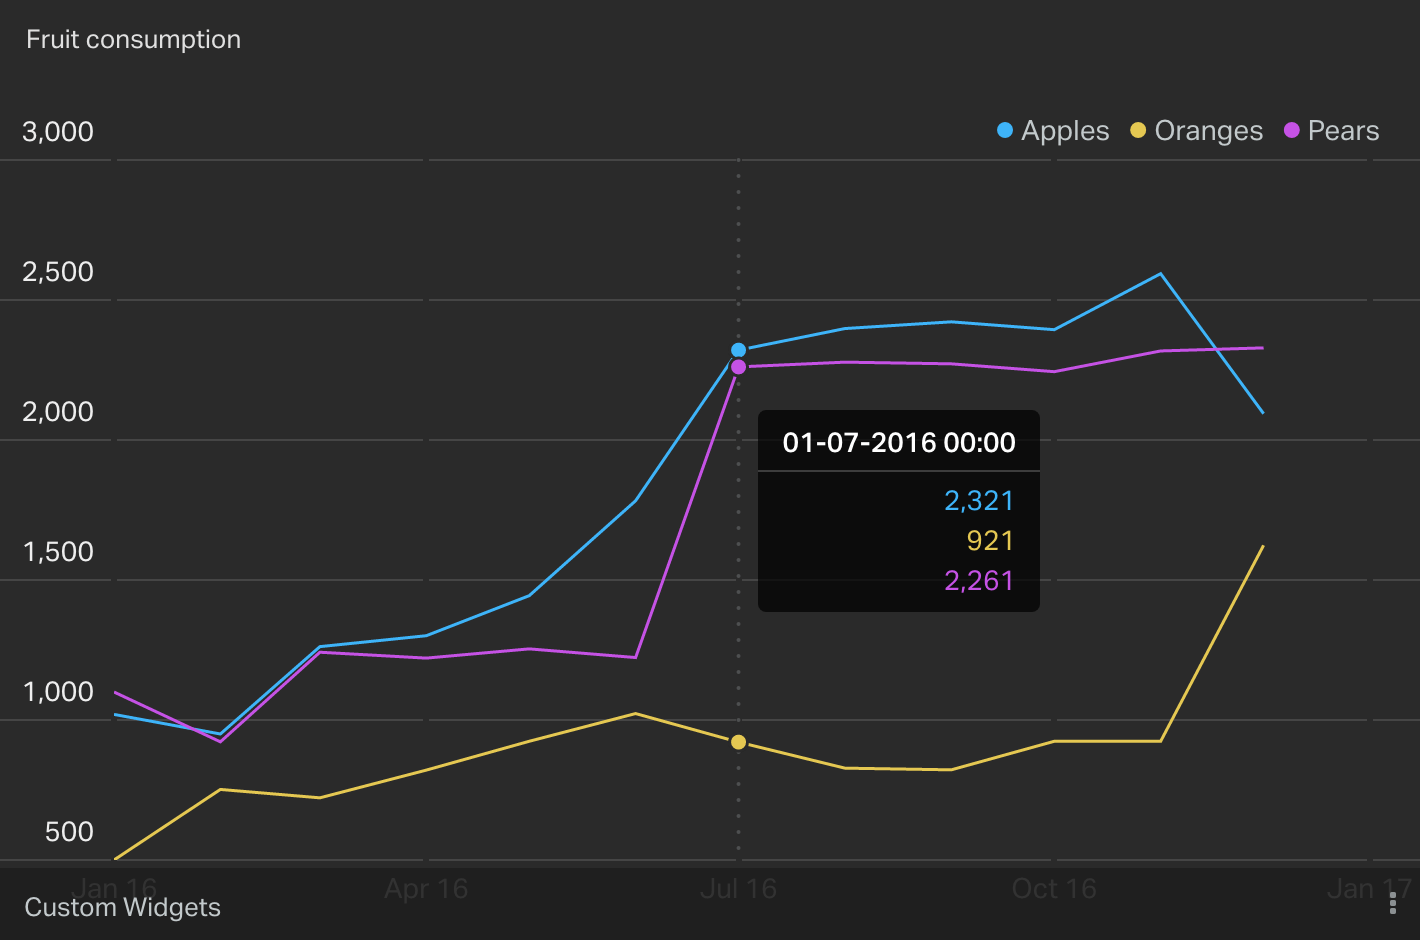
To make it easier to read off the values on your line charts, we’ve upgraded the tooltip. The new tooltip fully supports multiple series and now also includes the x-value so you know exactly which point it’s referring to.
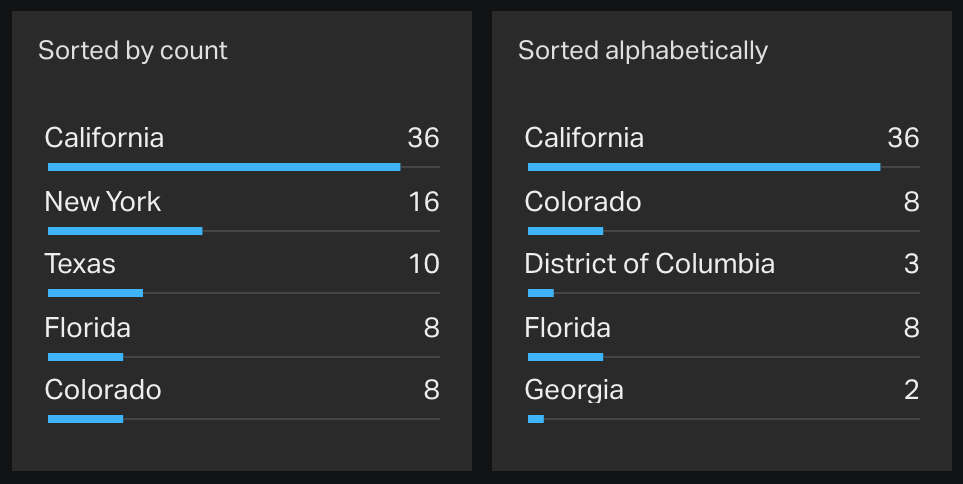
To give you added control over how your Salesforce bar charts are plotted, the integration now takes into account the sort order saved in your Salesforce report.
As an example of what this let’s you achieve, here’s the same chart sorted by record count in the first and alphabetically in the second.
We wanted to share more of the updates, fixes and improvements we’re shipping every day at Geckoboard, so say Hello to our What’s New section. We’ll be posting here frequently to let you know about any product changes as and when they’re released - stay tuned!